By Lacie Blankenship
Don’t say gay? Why not? Amid a recent and historic wave of anti-LGBTQ legislation (primarily concentrated in the American South), 2023 Pride Month honored a growing and vibrant movement for a community that remains resilient after generations of struggle and discrimination. And while it’s not breaking news that some of the legislation coming out of the South presents an anti-LGBTQ agenda, a new research study found that despite consistent stigmatization in everyday life, LGBTQ Southerners view their LGBTQ identity in a positive light.
The study’s authors, Gabrielle Lopiano (Vanderbilt University), Giacomo Negro and Melissa J. Williams (both Emory University), Ashlei R. Petion (Nova Southeastern University), and Ryan M. Roemerman (LGBTQ Institute, National Center for Civil and Human Rights), shed light on LGBTQ Southerners’ life experiences through a survey with a uniquely large sample size (1,326 respondents).
What is stigmatization?
Stigmatization is the process of labeling or treatment of people based on specific characteristics perceived as negative or deviant by society. Stigma can be public, social, internalized, or institutional, opening the door to discrimination, marginalization, social exclusion, harassment, etc.
Key Takeaways
The research findings are organized into 8 major sections. Below are the sections and only a few key takeaways listed in the report findings.
Sample Characteristics
- 39% of respondents identified as gay, 22% identified as bisexual/pansexual, 18% identified as lesbian, and 21% identified as another queer sexual orientation.
- 29% of respondents identified as female (non-transgender), 41% identified as male (non-transgender), 5% identified as nonbinary (non-transgender), and 25% identified as transgender (female, male, and nonbinary).
- For more sample characteristics, click here.
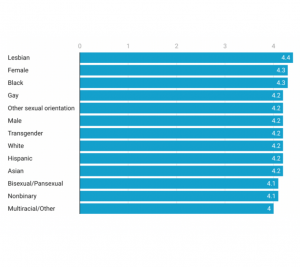
This figure (Figure 16 from the survey report) shows responses to the question, “Thinking about your LGBTQ identity, do you generally think of it as something positive or negative in your life today?” Respondents answered on a scale of 1 to 5 with 1 being “Very Negative” and 5 being “Very Positive.” All respondents reported viewing their LGBTQ identity as somewhat positive.
LGBTQ Identity and Experiences
- 78% of respondents think their LGBTQ+ identity is something positive in their lives.
- 83% of respondents reported being subjected (a few times or more) to slurs or jokes because they are, or are perceived to be, LGBTQ+.
- One in 10 reported experiencing efforts to “convert” or change their sexual orientation and/or gender identity (‘conversion therapy’).
School Experiences
- 54% of respondents reported having been harassed or bullied for being LGBTQ+.
- Multiracial/Other identified respondents were most likely to report changing schools to avoid or minimize discriminatory treatment.
- 20% of respondents reported having skipped school to avoid discrimination.
Workplace Experiences
- 56+% of the respondents view their workplace as very accepting for LGBTQ+ employees, and 71% of the respondents answered having more than one individual they consider an ally at work.
- 55% of respondents avoided discussing personal topics with coworkers, supervisors, or bosses to avoid discrimination or harassment at work for being LGBTQ+.
- Respondents who identified as bisexual/pansexual (46%), and over half (52%) of transgender respondents said they actively tried to pass as not being LGBTQ+ to avoid discrimination or harassment at work.
Health and Healthcare Experiences
- 31% percent of transgender respondents reported avoiding healthcare.
- 20% of transgender respondents reported receiving inappropriate curiosity from healthcare staff when accessing healthcare this year.
- 43% of transgender respondents reported being misgendered or inappropriately named when trying to access healthcare this year.
Political Attitudes and Voting Behavior
- Most respondents are politically active, informed on current events, and contribute financially to candidates: 70% of respondents donated to campaigns in the previous 12 months or earlier, with 71% saying they donated to candidates who supported LGBTQ+ rights.
- 93.4% of respondents refused to purchase products from companies unsupportive of LGBTQ+ rights. Nearly 93% rewarded companies supportive of LGBTQ+ rights by purchasing their products.
- Respondents’ top priorities for advocates and political leaders were protecting marriage for same-sex couples, healthcare coverage for transgender people, adoption rights for same-sex couples, and stopping laws that permit discrimination against LGBTQ+ people based on religion.
Community Perceptions and LGBTQ Involvement
Attending an LGBTQ+ pride event, a rally or march, and being a member of a state or local LGBTQ+ organization were the most common community activities respondents indicated.
- Attending an LGBTQ+ pride event (81.8%), attending a rally or march supporting LGBTQ+ rights (68.4%), and being a member of a state or local LGBTQ+ organization (57.6%) were the subsequent most common activities respondents were engaged in with half (49.9%) reported being a member of a national LGBTQ+ organization.
Travel and Leisure
- When considering travel in the South, the most important factor for respondents was the things to see and do (57%), with concerns about safety and security being the second most important factor (27%) when traveling.
- The majority cited Atlanta, Georgia, as the most accommodating destination, followed by Asheville, North Carolina; New Orleans, Louisiana; and Key West, Florida.
For more takeaways or to review the full report, click here.
“It’s important to know that people are not seemingly internalizing the stigma that they are experiencing. It appears that our respondents mostly see their LGBTQ identity as a positive thing in their lives,” says Lopiano. “At the same time, there’s still consistent discrimination, so we’re seeing how much resilience is involved in overcoming it. We have to do work to understand these experiences.”
Survey Details
This anonymous survey is the second iteration of the LGBTQ Institute Southern Survey; the first was published in 2018. The 2022 survey was shorter than the original and slightly increased participation among people of color. The survey report discloses that LGBTQ people of color are still underrepresented in the sample; researchers asked respondents of color to participate in a follow-up survey and a series of focus groups. Additionally, the researchers disclose that although the sample size is impressive, it is a convenience sample and may not represent all LGBTQ people in the South.
“You don’t really find sample sizes this large for this understudied portion of the population,” says Lopiano. “Most studies you read like this are in bigger, more liberal cities. This specific group (LGBTQ Southerners) was expected to have pretty unique experiences relative to LGBTQ persons in other parts of the country.”
The survey, administered from June 2021 through March 2022, was voluntary, lasting 15-20 minutes, and offered in English and Spanish. Participants were recruited via the LGBTQ Institute website with the help of partner organizations and social media advertisements.
Participants had to go through a screening process addressing age and geographic restrictions. The questions addressed experiences regarding LGBTQ identity, workplace, high school, health and healthcare, politics, LGBTQ community, travel and leisure, and religion and conversion experiences. The Emory University Institutional Review Board reviewed the study.
Survey Implications
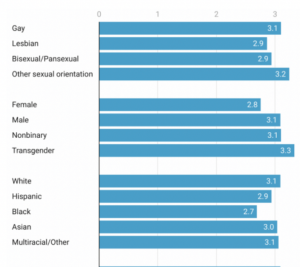
This figure (part of Figure 23 from the survey report) shows responses to the question, “How often have you been subject to slurs or jokes because you are, or were perceived to be, LGBTQ?” Respondents answered on a scale of 1 to 5 with 1 being “Never” and 5 being “Very Frequently.” All respondents reported having experienced, at least a few times being the subject of slurs or jokes because there are, or were perceived as LGBTQ. The full figure can be found on page 24 of the survey report.
Policy
“I certainly think policymakers in these states should pay strong attention to these results,” says Lopiano. “The obvious next questions are: How do LGBTQ discrimination experiences influence local economies? How is it influencing migration patterns? Are people leaving these states because of these negative experiences?”
Healthcare
Lopiano also noted that extra efforts to understand these experiences compared to the general population are essential, especially in the survey sections discussing health.
“Especially because we know that more people in Gen Z are identifying as LGBTQ, if we don’t put a stop to this growing trend of discrimination, and if we don’t ensure that healthcare outcomes improve, we’re going to be looking at more and more health crises,” she says.
Employment
“Employers need to look and see what’s really happening in their companies,” says Lopiano. “What’s the inclusion and experience like for people who belong to this demographic, and organizations in the South can put pressure on the government and stand up for the employees and groups of people that need powerful allies in this geographic region.”
Other Comments
Lopiano noted the extra care needed for the nonbinary and transgender community when discussing this survey. Nonbinary and transgender survey respondents reported more negative experiences, more experiences of stigma and discrimination, and worse health outcomes. In a time where anti-trans legislation and rhetoric are at the forefront of America, especially the South, leaders of all disciplines must push for a world where everyone can live and thrive.

Gabrielle Lopiano
“Our primary research aim is to improve public and scientific understanding of the contemporary life circumstances and social experiences of LGBTQ people living across the American South with the hope that this research amplifies the voices of the issues affecting our lives and serves as a tangible tool for partner organizations (many of which are completely volunteer-led and have limited resources) as they develop their policy initiatives, fundraising campaigns, and grassroots strategies,” the authors write.
Resources
For a list of Vanderbilt LGBTQIA+ resources, click here. For a list of Nashville LGBTQIA+ resources, click here.